一剑行天下's Blog
Happy coding
利用GNUplot科学绘图
1. Linux下的安装
在命令行下输入
# apt-get install gnuplot
系统自动获取包信息、处理依赖关系,就可以完成安装
安装完毕后,在命令行下运行:
$ gnuplot
就进入了gnuplot
系统出现:
gnuplot>
这个是这个软件的提示符,熟悉shell的同学都晓得这个gnuplot的shell。所有的命令都在这里输入。
2. Windows下的安装
到http://www.sourceforge.net搜 索gnuplot,然后下在win32的zip压缩包,里面包含全部需要的文件,下载,释放到本地硬盘的目录里,假设是c:\gnuplot。然后到这个 目录的下查找bin这个目录,在bin目录下有一个名为wgnuplot.exe的文件,双击该文件,就出现了GUI界面的gnuplot。
2.应用
一 般情况下使用gnuplot都是科学绘图,因此很多都是放在文章里面。一般优秀的科技文献都是用latex来编写的,所以gnuplot提供了直接输出 tex文件的功能,只需要把output设置为latex就可以了。下面来看一个例子,就把上面的正弦曲线插入到你的文章中。在命令行下输入:
gnuplot> set terminal latex
set output "sin.tex"
plot [-3.14:3.14] sin(x)
那么程序自动生成了一个tex文件,其包含一系列代码,都是绘图用的,可以用写字板打开,里面都是一些指令,你完全可以忽略掉。你可以把这个文件直接插入你的文章中,例如
\begin{figure}
\begin{center}
\input{sin.tex}
\end{center}
\end{figure}
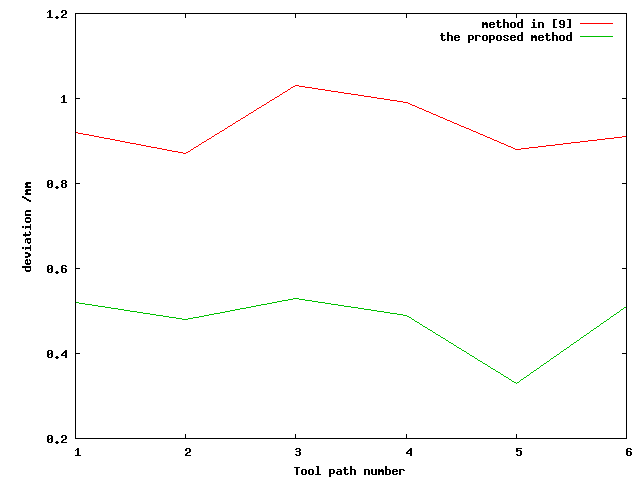
3.折线图绘制
首先进入gnuplot环境
$ gnuplot //进入环境命令
gnuplot> set xlabel "Tool path number" //设置x轴标签 "Tool path number"为x轴坐标名称
gnuplot> set ylabel "deviation /mm" //设置y轴标签 "deviation /mm" 为y轴单位名称
gnuplot> set ytics 0.2 //设置y轴的坐标间隔
gnuplot> set terminal png //设置最终图片格式
gnuplot> set output "output.png" //设置输出图片名称
gnuplot> plot'Literature[9]method' u 1:2 title"Literature[9]method" w l,'Algorithm' u 1:2 t "Algorithm" w l //设置绘图所用数据,Literature[9]method 为第一组数据的文件名(可任意命名),Algorithm为第二组折线数据文件(可任意命名),u 1:2 title"Literature[9]method"的意思是用(u为use的所写)第一组数据中的第一列为x轴第二列为y轴会折线 (w 和l 的意思是with 和line的缩写 ,表示用直线段绘制折线 ),数据而同理绘制。
gnuplot> replot
gnuplot> q
最后Literature[9]method中的数据格式为:
1 0.52
2 0.48
3 0.53
4 0.49
5 0.33
6 0.51
最后绘制的图形如下:
命令:
gnuplot>plot'Literature[9]method' u 1:2 title"method in [9]" w l,'Algorithm' u 1:2 t "the proposed method" w l
 评论 (0)